Blog
This is the third in a series of articles describing a simplified example of near real-time Ad Campaign reporting on a fixed set of campaign dimensions usually displayed for analysis in a user interface. The solution presented in this series relies on Kafka, Aerospike’s edge-to-core data pipeline technology, and Apollo GraphQL
Part 1: real-time capture of Ad events via Aerospike edge datastore
andKafka messaging.Part 2: aggregation and reduction of Ad events via Aerospike Complex Data Type (CDT) operations into actionable Ad Campaign Key Performance Indicators (KPIs).
Part 3: displaying the KPIs in an Ad Campaign user interface displays those KPIs using GraphQL retrieve data stored in an Aerospike Cluster.
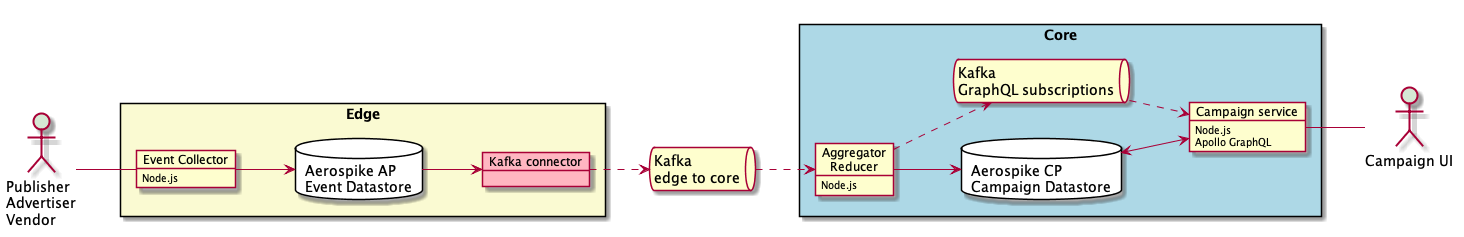
Data flow
Summary of Part 1 and Part 2
In part 1, we
used an ad event simulator for data creation
captured that data in the Aerospike “edge” database
pushed the results to a Kafka cluster via Aerospike’s Kafka Connector
In part 2, we then
consumed events from Kafka exported via Aerospike’s Kafka Connector
aggregated each event into Campaign KPIs on arrival
published a message in Kafka containing the new KPI value
Parts 1 and 2 form the base for Part 3
The use case — Part 3
Part 3 has two use cases:
displaying Campaign details in a UI
updating Campaign KPIs in real-time
As mentioned in Part 2, the KPIs, in this example, are very simple counters, but the same techniques could be applied to more sophisticated measurements such as histograms, moving averages and trends.
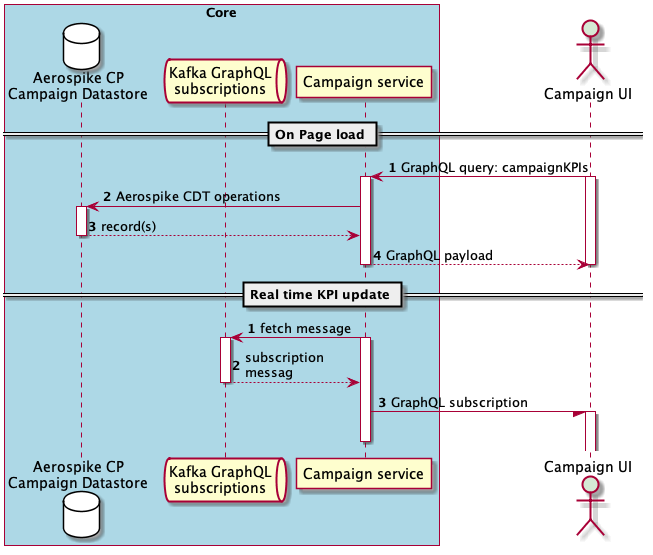
The first use case reads the Campaign details, including the KPIs from Aerospike record.
The second use case is based on a GraphQL subscription specific to a Campaign and KPI. A subscription message with the new KPI value is sent from the campaign-service to the campaign-ui when the KPI has changed.
To recap — the Aerospike record looks like this:
record structure
The Core Aerospike cluster is configured to prioritise consistency over availability to ensure that numbers are accurate and consistent.
This sequence diagram shows the use cases:
On page load
KPI update
Campaign Service and UI scenarios
Companion code
The companion code is in GitHub. The complete solution is in the master branch. The code for this article is in the ‘part-3’ branch.
Javascript and Node.js are used in each back-end services, although the same solution is possible in any language.
The solution consists of:
Campaign service — Node.js and Apollo GraphQL Server
Campaign UI — React, Material UI and Apollo GraphQL Client React
Docker and Docker Compose simplify the setup to allow you to focus on the Aerospike specific code and configuration.
What you need for the setup
All the prerequisites are described in Part 1.
Setup steps
To set up the solution, follow these steps. The Docker images are built by downloading resources, be aware that the time to download and build the software depends on your internet bandwidth and your computer.
Follow the setup steps in Part 1. Then
Step 1. Checkout the part-3 branch
$ git checkout part-3Step 2. Then run the following command to delete the Aerospike data and the Kafka topics data.
$ ./delete-data.shStep 3. Finally, run
$ docker-compose up -d
$ docker-compose logs -f publisher-simulator
Once up and running, after the services have stabilised, you will see the output in the console similar to this:
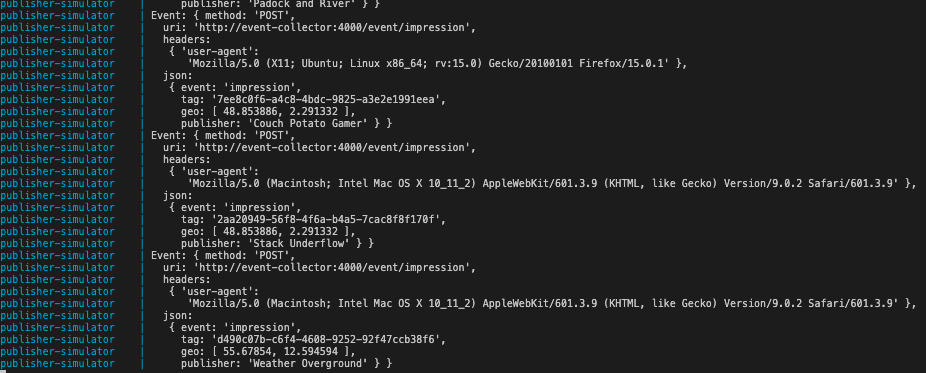
Sample console output
Step 4. Go to the UI with this URL:
http://localhost:5000/to display the Campaign application.
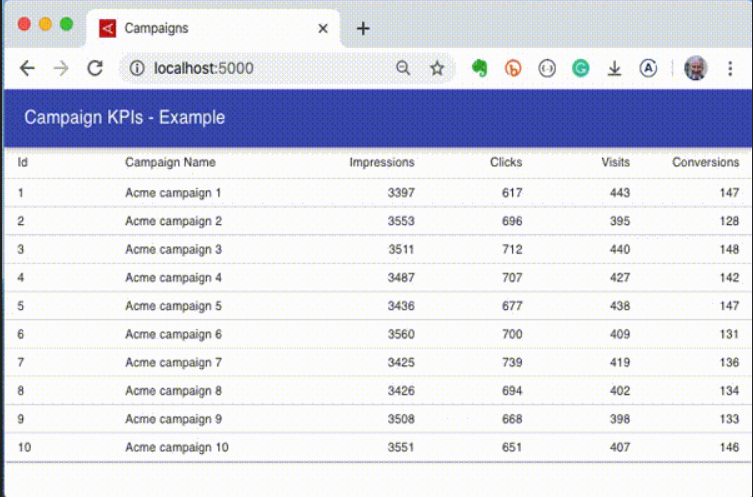
Campaign UI
Note: you are now running 12 services on your local machine.
How do the components interact?
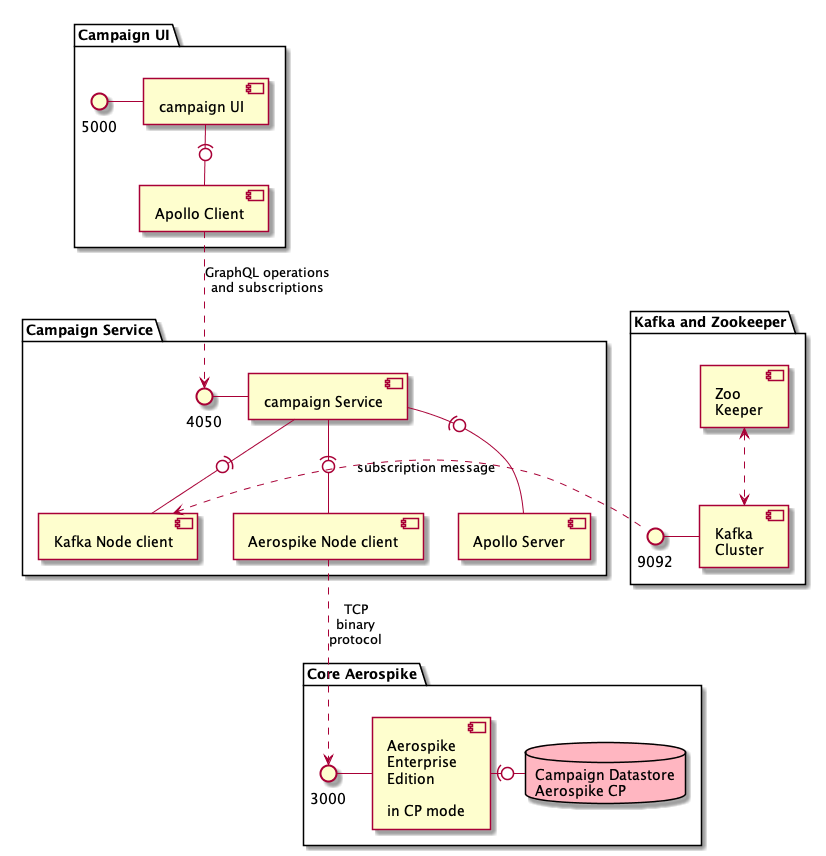
Component Interaction
Docker Compose orchestrates the creation of twelve services in separate containers: All of the services and containers of Part 1 and Part 2 with the addition of: Campaign Service campaign-service – A node.js and Apollo GraphQL Server service Like the services in Part 1 and Part 2, the campaign-service uses the Aerospike Node.js client. On the first build, all the service containers that use Aerospike will download and compile the supporting C library. As mentioned in Part 1 and Part 2, the Dockerfile for each container uses multi-stage builds to minimise the number of times the C library is compiled. Campaign UI campaign-ui – A React and Material UI single-page web application to display Campaign KPIs, it uses the Apollo Client React GraphQL client.
How is the solution deployed?
Each container is deployed using docker-compose on your local machine. Note: The campaign-service and campaign-ui containers are deployed along with all the containers from Part 1 and Part 2.
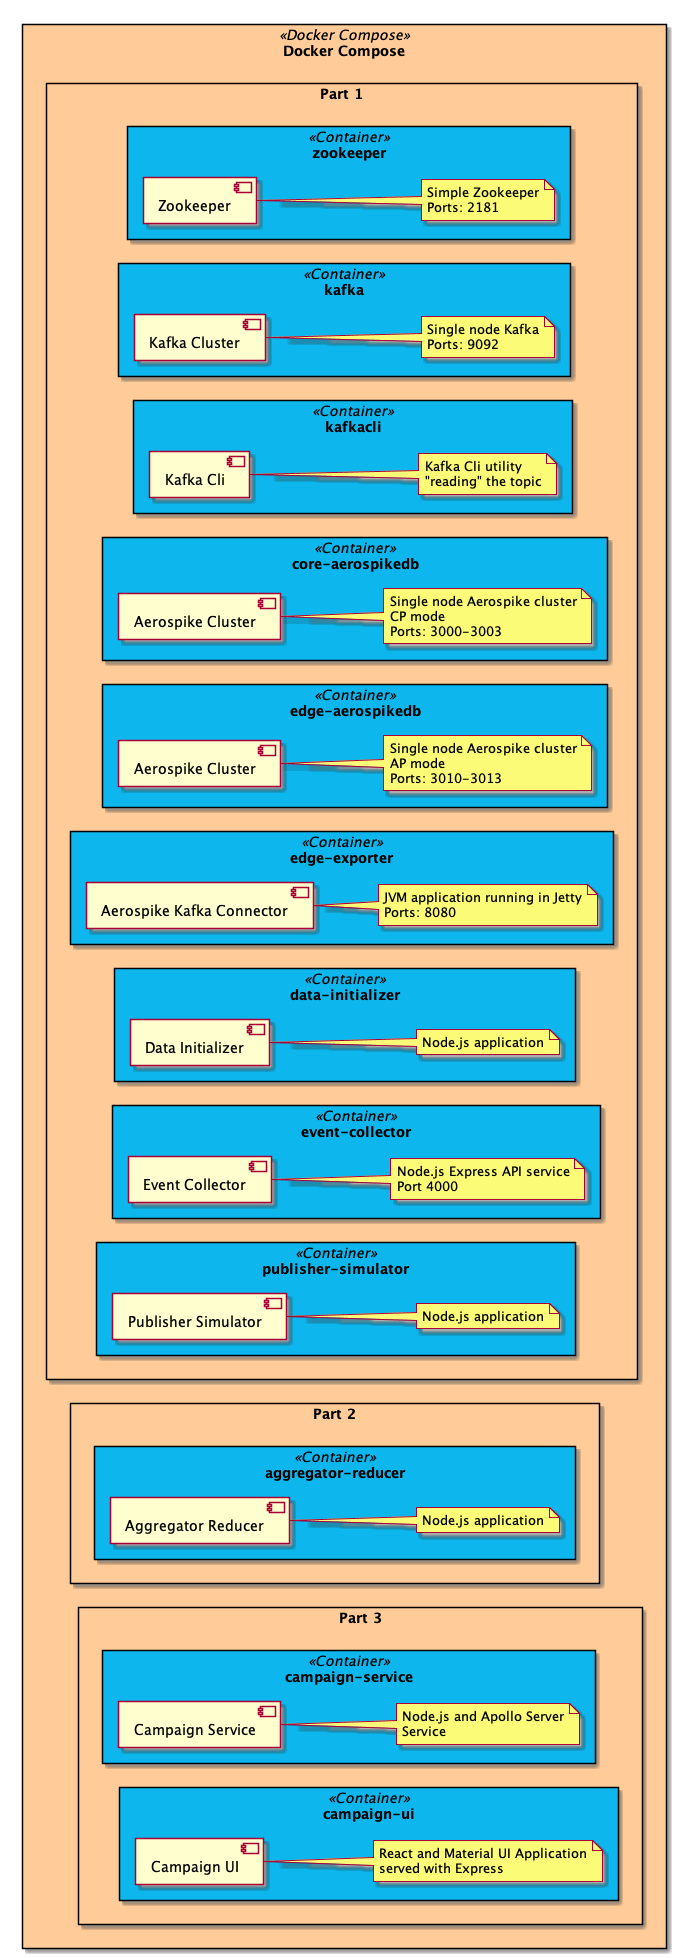
Deployment
How does the solution work?
Campaign service
The campaign-service is a deliberately simple Apollo Server providing a GraphQL schema and the resolvers for the root operations defined in that schema.
index.js
src/index.js contains:
a GraphQL server
a schema in Schema Definition Language
resolvers for the root operations
Note: this is an example server only and is not structured for production.
Schema definition
The schema defines the types of:
Campaign– Campaign metadata
CampaignKPI– the set of KPIs for a Campaign
KPI– a single KPI, e.g.
impressions
Queries of:
campaign(id:ID!)– returning a single Campaign
campaigns(ids:[ID!]!)– returning a set of campaigns matching the Ids passed
and Subscriptions of:
kpiUpdate(campaignId:ID!, kpiName:String)– posts a KPI event when a KPI update occurs matching the
campaignIdandkpiName
GraphQL Schema
Resolvers
Each field in GraphQL can have a resolver function defined to resolve the value of the field.
In this schema we have defined resolvers for:
Query
campaign(…)
campaigns(…)
Subscription
kpiUpdate(…)
Query resolver function names match the field names of campaign and campaigns and they delegate to the campaign data source CampaignDataSource.js.Query resolvers
The single Subscription resolver kpiUpdate implements a filter allowing the front end to subscribe to a KPI for a specific campaign and KPI name.
Subscription resolver
It is a surprisingly small amount of code to implement a GraphQL Schema and Server.
CampaignDataSource.js
src/CampaignDataSource.js is the connector to Aerospike, whose job is to read aerospike Campaign records and transform them into the type described in the GraphQL schema.
Fetching a single record by ID
Fetching a single campaign is implemented using the Aerospike get operation. The whole Aerospike record is read using the primary key and transformed into the GraphQL type (see Transforming a record to a Campaign).
Fetching multiple records an array of IDs
To fetch multiple Campaign records we use the Aerospike batchRead operation. The batchRead operation reads the requested records concurrently, this is very efficient in a multi-node cluster as records are evenly distributed across nodes and each node will do about the same amount of work to locate and return the requested records.
Fetching multiple records using a query
This function is not actually used in the solution, but it does illustrate how to use Aerospike’s query capability based on a secondary index and filters.
Transforming a record to a Campaign
A Campaign record is stored in a set of Bins, and these are transformed to the GraphQL types.
Aerospike record and GraphQL types
{
    "c-id": 10,
    "stats": {
      "visits": 0,
      "impressions": 0,
      "clicks": 0,
      "conversions": 0
    },
    "c-name": "Acme campaign 10",
    "c-date": 1581683864910
}

..into

type Campaign {
    id: ID
    name: String
    aggregateKPIs: CampaignKPI
  }
  type CampaignKPI {
    clicks: Int
    impressions: Int
    visits: Int
    conversions: Int
  }
The function takes the Aerospike record and returns a Campaign type:
KpiReceiver
The KpiReceiver listens to the Kafka topic subscription-events and when a message is received, it is published as a GraphQL subscription. Using Kafka as the pub-sub technology allows the campaign-service to scale without the KPI event being lost.
Most of the work is done in this code:
Note: pubsub (line 4) as part of the apollo-server npm package and does all the heavy lifting in implementing GraphQL subscriptions. The pubsub reference is passed into the constructor:
Campaign UI
The campaign-ui is a single page web application implemented using React, Material UI and Apollo GraphQL Client React.
The application is implemented by composing the Components:
ApolloProvider
App
CampaignList
CampaignRow
Kpi
index.js
Setting up a React application to use Apollo GraphQL is quite straight forward by following this guide.
In our code, we will use GraphQL Subscriptions implemented with websockets and Apollo provides all the helper classes and functions to achieve this.
First, we create a link to our GraphQL server:
then we create a web socket link:
We can optimise the communications paths to the server by splitting the link based on the operation type.
We also add a client-side cache — not necessary in this example, but fun to add anyway.
Finally, we create an ApolloClient instance.
ApolloProvider is a HOC from Apollo that encapsulates the App component and passes down the ApolloClient instance as a property and is available to child components of App.
The React application component is ready to interact with the campaign-service.
CampaignList
CampaignList.js is a table using Material-UI components. An array of campaign Ids is passed in props. These Ids are use in the GraphQL query:
`Campaign query
The render() method creates a TableContainer with a TableHeader, each row in the table is CampaignRow component.
render() method
CampaignRow
The CamaignRow component receives the “campaign” via props. Each KPI column is implemented using the Kpi component.
Kpi
The Kpi component renders the KPI value and, more interestingly, subscribes to the defined GraphQL subscription kpiUpdate.
GraphQL Subscription
The component is rendered by including the GraphQL subscription to listen for KPI updates.
render() method
In order to highlight the change in a KPI value, the new value is turned red for about 1 second.
The whole story
In this series, we have used Aerospike and Kafka to build a simple edge-to-core solution to capture real-time ad events for Campaign Reporting.
The “Edge” portion of the solution would be deployed geographically and the “Core” would be deployed centrally using a hub and spoke pattern.
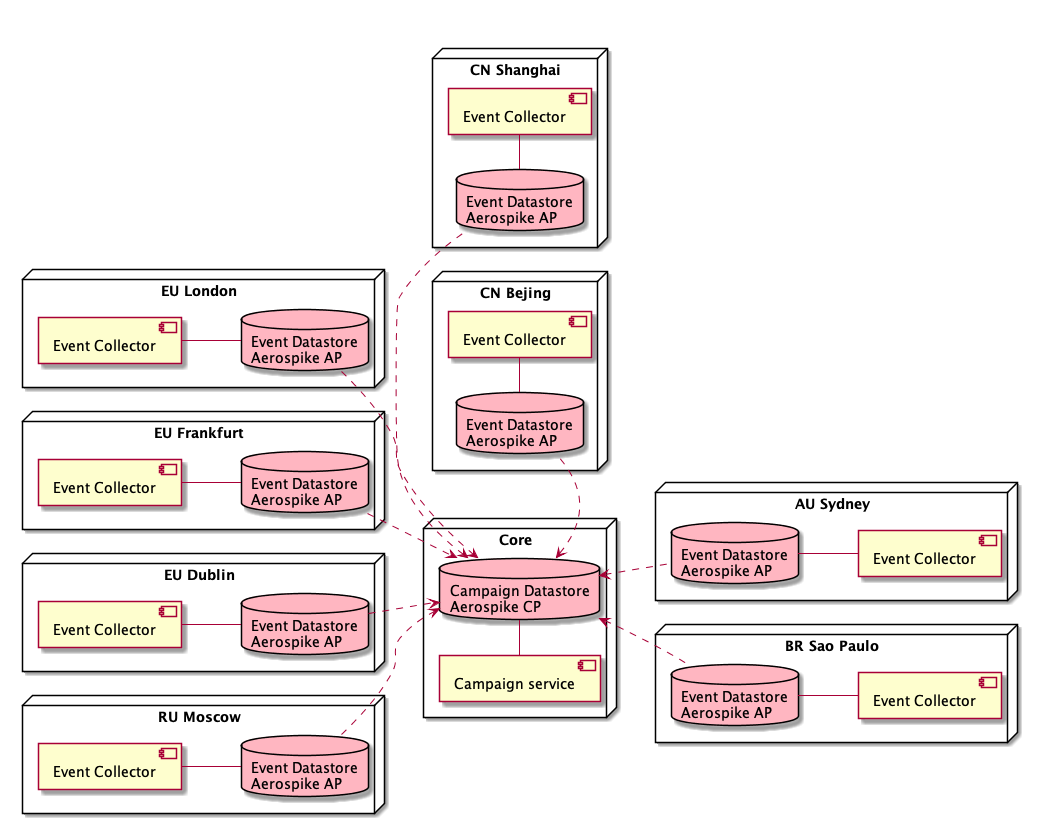
Geographical deployment of “edge” and “core”
Event sequence
Users interact with ads on Publisher websites and the interaction events are sent to the local “edge” event collector and datastore.
Event data is propagated to the “core” aggregator/reducer using Kafka. The aggregator/reducer takes each event and aggregates it with the designated KPI, in this example, the KPIs are simple atomic counters stored in an Aerospike CDT.
Using the Campaign UI, campaign specialists can monitor the KPIs in real-time for campaign optimisation. KPIs are updated live, without costly page loads or polling, using GraphQL subscriptions.
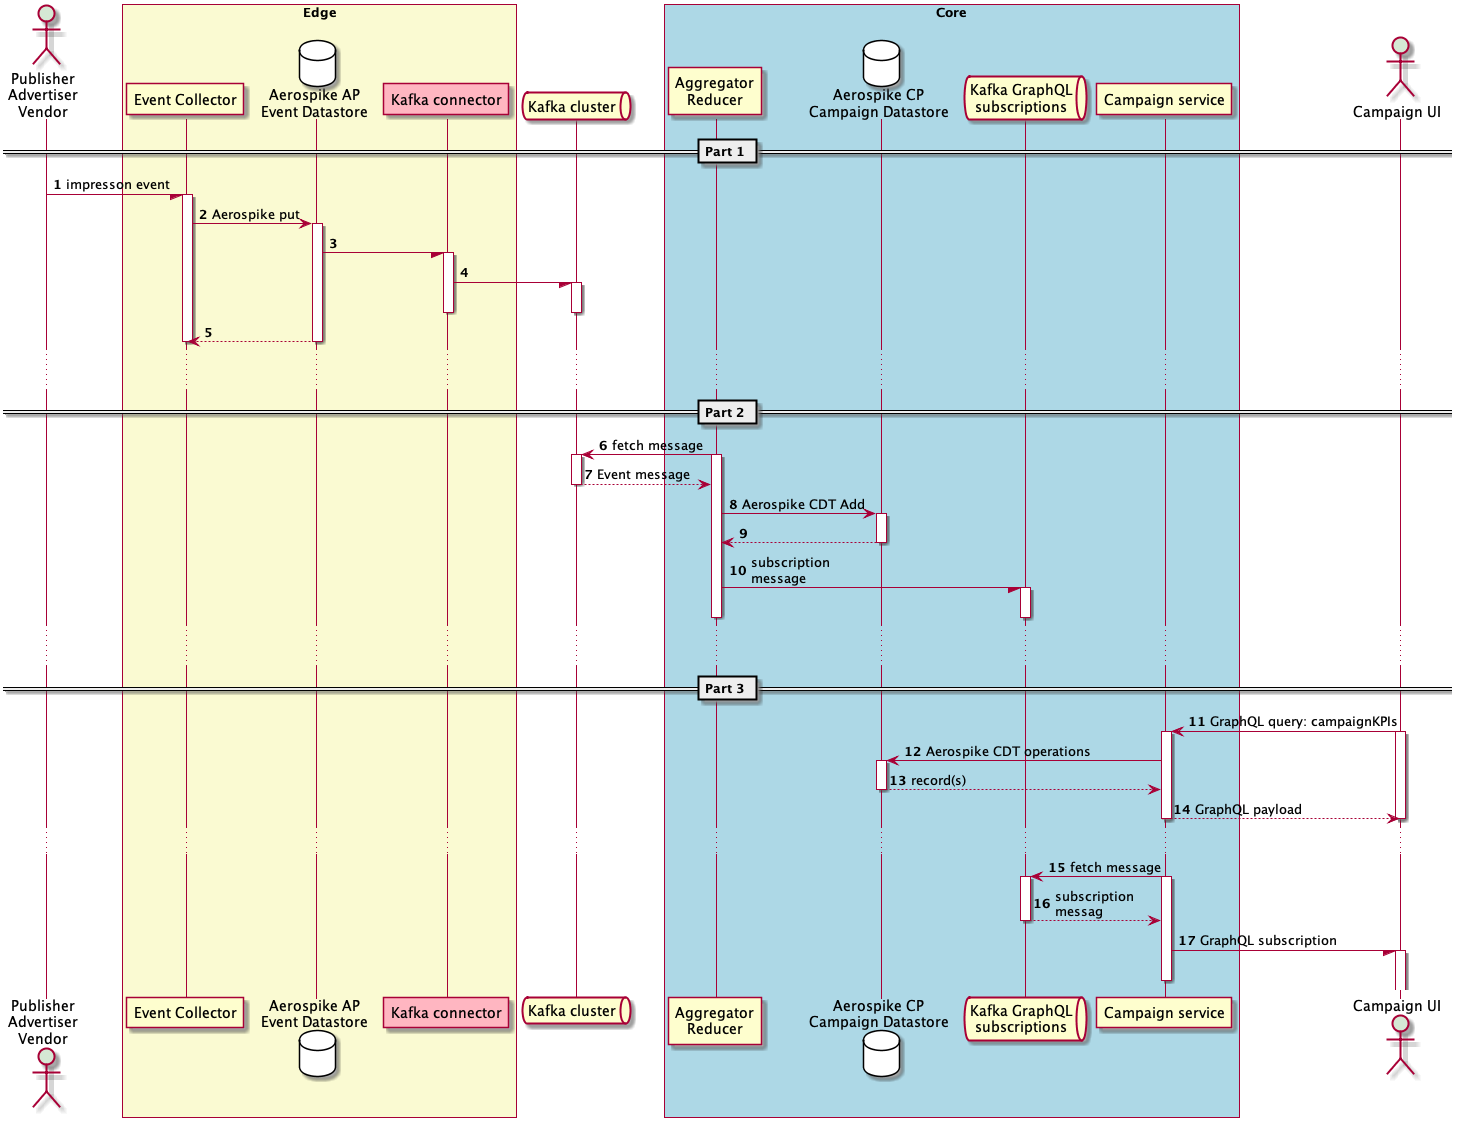
Event Sequence
The complete component interaction
The complete component diagram shows all the components, their packages and their interaction with each other. The packages are dockerized for deployment, vastly reducing the risk of production failures due to a missing dependency. We have used docker-compose in this example; in a real-world environment, Kubernetes is a great choice for container orchestration.
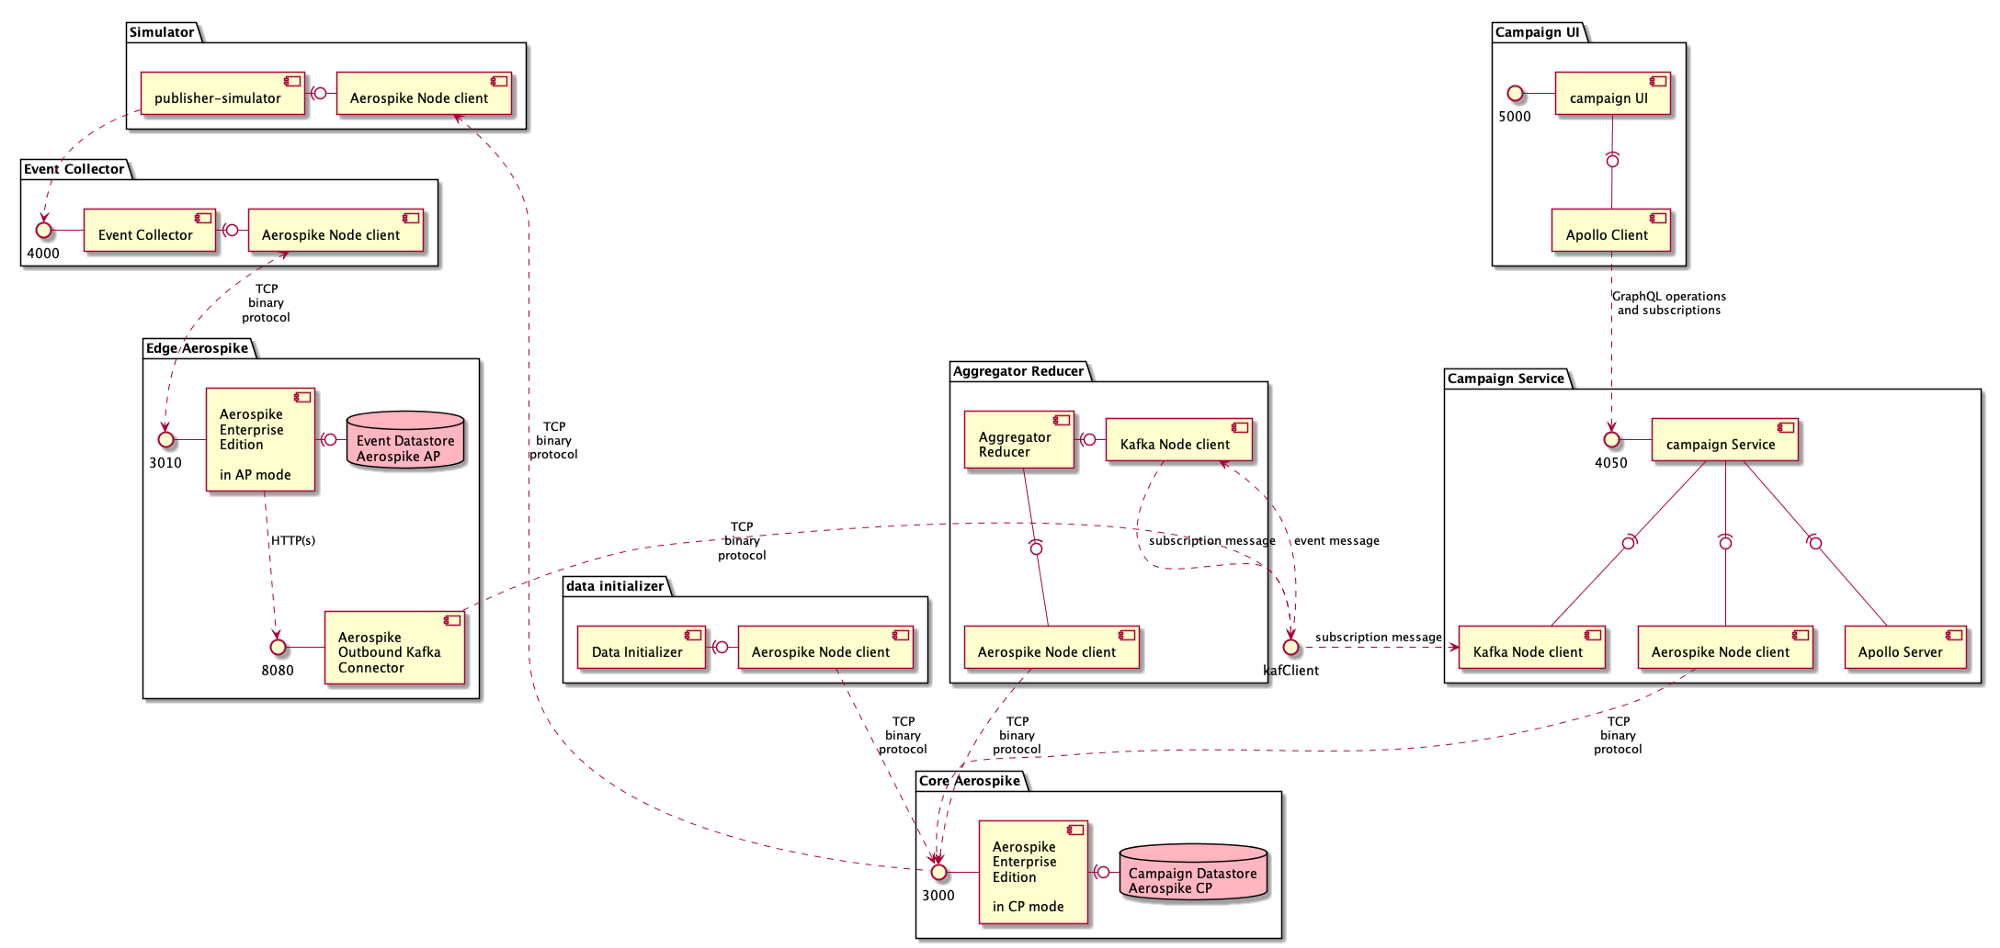
Components
Review
Part 1 of this series describes:
creating mock Campaign data
a publisher simulator
an event receiver
an edge database
an edge exporter
Part 2 describes the aggregation and reduction of Ad events into Campaign KPIs using Kafka as the messaging system and Aerospike as the consistent data store.
Part 3 (this article) describes the Campaign service and Campaign UI for a user to view the Campaign KPIs in near real-time.
Possible improvements to the entire application
The KPI data structure (cube) and event aggregation are deliberately simple to illustrate the technologies used. Here are a few improvement ideas:
— Event aggregation using Spark. Spark streaming can be used for more sophisticated aggregation and reduction. Aerospike provides a Spark Data Frame which makes integration of Spark and Aerospike easy.
— The Campaign Service and UI. These are very basic and show only a portion of the possible functionality. Campaign management is complex and a complete campaign management service and UI are outside the scope of this article. A simple improvement would provide functionality for the user to specify the campaigns to monitor.
Disclaimer
This article, the code samples, and the example solution are entirely my own work and they are not endorsed by Aerospike, Confluent or Apollo. The code is PoC quality only and it is not production strength and is available to anyone under the MIT License.
Additional resources
For a deeper understanding and more insights, explore these additional resources.
See more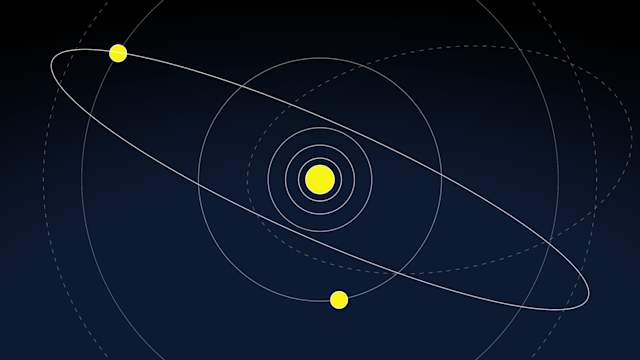
Blog
KV cache tiering: Why GPU memory alone won't scale your LLM app
Read more
Blog
Fail fast, stay resilient: How to stop hidden gray failures in Aerospike on AWS EBS
Read more
Blog
Determining the best machine learning and AI databases
Read more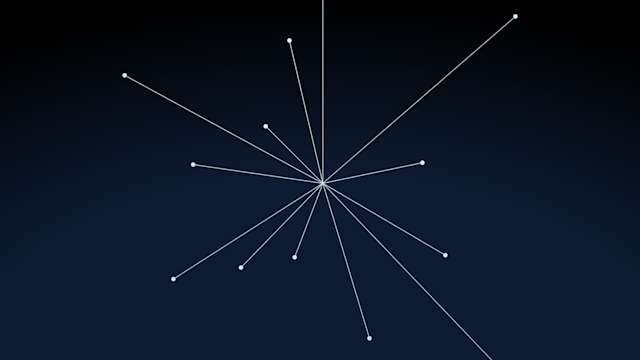
Blog