Best practices for database benchmarking
Determining the optimal database solution is not always straightforward. Benchmarks play a crucial role in driving informed decisions for users and vendors by separating science from marketing.

Which database is “best” isn’t always an easy question. That’s the purpose of benchmarks: to help users determine which database software best suits their needs based on factors such as performance and cost.
Benchmarks also help vendors and users ensure their products perform as expected. As a vendor with customers and a community who trust and believe in us, it is our duty to test the quality and performance of the software we deliver.
What is database benchmarking?
A benchmark is a standardized test for a database. The results give both users and vendors an idea of how the database will perform in use. In addition, people running the benchmark can tweak several factors to determine how the database will perform under different conditions.
Database benchmark comparisons
Frequently, people run database benchmarks to compare two or more database products. If they’re users, they might do this to choose between a NoSQL database and an SQL database, depending on their needs. If they’re vendors, they might be doing this to determine how to position their product in the market, where it falls short, how it outperforms, and where it needs to improve. The result is that everyone benefits.
Honest database benchmarks separate science from marketing. Think of it like a test drive, where you’re comparing a Tesla with a Ford F-150. The Tesla might go faster without gasoline, but if you have a big load to carry or are going a long distance, the Ford F-150 might be a better choice depending on the data type and specific database performance requirements.
So, what factors are critical in determining a valid benchmark comparison?
Benchmarks must be transparent.
They should clearly describe the hardware and configuration used for the tested systems.
They should tune a competitor’s system following best practices to give it a fair chance.
They need to cover realistic use cases and avoid narrow tests that artificially constrain or improve results from unlikely scenarios. Far too often, vendors “game” benchmarks in ways that deliberately or accidentally mislead development teams.
They should be reproducible by a third party.
To this end, Aerospike conducts periodic performance benchmarks of its technology and releases the results and code to reproduce the results publicly. Any technologist should be able to replicate our tests, critique our methodology, and discuss the results.
Aerospike will publish not only its own benchmarks but also those conducted by independent third parties. In addition, we will attempt to duplicate benchmarks published by other database vendors so development teams can make informed decisions about speed and scale.
What is a database benchmark?
When people talk about benchmarks, you may hear them use the term CRUD. This isn’t a dig against the database or the benchmarking test but a reference to the four main types of operations that a database performs: Create, Read, Update, and Delete. Databases may have different performances for these operations, so it’s important to test for all of them.
Before starting any testing, it’s also important to identify what you aim to achieve with your database benchmark. Consider factors such as the expected number of users, transaction volumes, and response time requirements. These will help determine the load parameters and performance metrics you’re looking to benchmark – as well as the infrastructure needed.
Benchmarks can be run in two ways: “real” or “synthetic.”
Synthetic
A synthetic database benchmark is a performance test designed to simulate the workload of specific tasks or processes. These benchmarks are typically created in a lab setting and are used to evaluate the performance of different hardware or software systems. Synthetic benchmarks simulate real-world workloads using an identical pattern, as in the YCSB workloads, and can be useful for comparing non-relational databases or relational databases side by side.
Real
While synthetic benchmarks use artificial tests and workloads designed to stress specific system components, real-world benchmarks use actual applications and data to measure performance. Real-world benchmarks are often considered more accurate than synthetic ones, as they better represent a system’s database performance under actual usage conditions. However, they can be more difficult to set up and run, and the results can be harder to compare directly, especially when testing high availability or data replication, as the exact workload can vary from one test to another.
Planning a benchmark
So, what should a “good” database benchmark include? Here’s our opinion:
A non-trivial dataset size (often 1 TB and up)
A non-trivial number of objects (often from 20 million on up to 1 billion as practical)
Realistic object sizes
A distribution of object sizes
Latency and variation under load
Multi-node clusters to test database scalability
Node failure/consistency results
Scale out by adding nodes
Replication and persistence
An appropriate mix of read and write workloads to best approximate application workloads
To be a fair and transparent test, a representative benchmark should first test database performance, scalability, and test failure modes. The test must include full, reproducible code examples (including configuration) and result in the published database benchmark numbers.
What should a “good” benchmark not include? A fair and transparent test avoids using designs that skew benchmark results or reduce existing problems. Some techniques to be explicitly called out when used or avoided entirely are:
Short duration tests
Small, predictable datasets entirely in DRAM or, worse, fully in the L2-L3 cache
Non-replicated datasets
Lack of mixed read/write loads
Single node tests
Narrow, unique-feature benchmarks
At Aerospike, we test both speed and scale simultaneously. Speed without scale is a dead end for successful applications. Scale without speed subjects users to unmitigated inflation in costs, such as server acquisition and operating costs, as well as IT ops risks – and, worst of all, potential tech stack redesigns.
What are some database benchmarking tools?
The Yahoo! Cloud Serving Benchmark (YCSB) is a popular tool for evaluating the performance of different types of database systems, particularly NoSQL databases. It was developed by Yahoo! to benchmark the performance of its cloud-serving systems and has since been adopted by many other organizations.
The YCSB database benchmark approach generates a workload that simulates operations a database needs to handle in the real world. This workload can be customized to represent different types of applications, allowing you to test how a relational database would perform under specific conditions.
One of the key features of YCSB is its flexibility. It supports a variety of NoSQL databases and allows for the testing of different types of workloads, including read-heavy, write-heavy, and balanced workloads.
Other tools include:
LoadRunner: Primarily used for understanding how systems behave under a specific load, which identifies and eliminates performance bottlenecks in the system; it supports a wide range of application environments, platforms, and databases
sysbench: A scriptable multi-threaded benchmark tool for evaluating OS parameters that affect a database system’s performance
NoSQLBench: An open-source, pluggable testing tool designed primarily for Cassandra but can be used for other NoSQL databases as well
Transaction Processing Performance Council (TPC): Primarily intended for SQL databases, some of this organization’s tools work with NoSQL databases as well
BenchmarkSQL: Modeled after TPC-C, it is a JDBC benchmark that mimics the transactional nature of real-world applications for Online Transaction Processing (OLTP) systems
ANN Benchmark: A popular tool for evaluating both scientific libraries and vector databases
How is database benchmarking data measured?
It depends on what benchmarking software is being used, of course, but here are some of the measured standard items.
Read throughput (operations per second): How many operations can the database read per second, on average?
Update throughput (operations per second): How many operations can the database edit or add per second, on average?
Read latency (in milliseconds): How long does it take the database to conduct a read operation in milliseconds, on average, or at the 95th percentile (p95), or at the 99th percentile (p99)?
Update latency (in milliseconds): How long does it take the database to conduct an update to the database in milliseconds, on average, or at the 95th percentile (p95), or at the 99th percentile (p99)?
Logically, you’ll want a system that has both the highest throughput and the lowest latency. Unfortunately, the world doesn’t work that way. Pushing throughput beyond a certain level may cause resource contention, e.g., CPU or network, which would then hamper latency. There is also the notion that hardware has limitations unique to the database software running on it, and adding more hardware will improve throughput while reducing latency (but only in some cases linearly).
So when you look at a benchmark comparison, you need to think about what you will use the database for most often: Reading and writing a large amount of data or retrieving data more quickly? The read-write ratios can be instructive and generally indicative of the application profile. For example, an Internet of Things (IoT) workload would have a much higher amount of writes than an e-commerce one looking up information. 80/20 read/write, and 50/50 read/write workloads are fairly common.
How to load test and benchmark databases
Want to run benchmark tests on your own? After you’ve figured out what you want to benchmark and what tools to use, here’s what you would need to do.
Step 1: Design the load test
Design test cases that simulate different types of database operations, such as:
Reads (SELECT queries)
Writes (INSERT, UPDATE, DELETE)
Concurrent reads and writes
Batch operations
Set up user scenarios that detail the sequence of operations for each simulated user. Also, decide on the ramp-up period to gradually increase the load on the database and the peak load you want to simulate.
Step 2: Set up the environment
Prepare your testing environment so that it closely mimics the production environment. This includes the hardware, network, database configurations, and the data volume. As mentioned, ensure the test database has enough data to provide realistic test results.
Regarding hardware or instance types, there are two schools of thought, and either can be correct depending on the databases being compared. One approach is to have identical infrastructure setups for each database being tested, so once each database is tuned and configured, you can make a direct inference on the performance. However, some databases, especially in NoSQL, are memory-first, whereas others, like Aerospike, are storage-first. You could then optimize the hardware for each but hold them to a different common denominator: number of servers or instances, total cost, or CPU/vCPUs. In this way, neither system gains an advantage by having the other running on sub-optimal hardware.
Step 3: Run the load test
Run the designed tests while monitoring the database performance. Look for metrics such as:
Throughput (operations per second)
Latency (response times)
Concurrency (number of open connections)
Resource utilization (CPU, memory, disk I/O)
Step 4: Analyze results and identify bottlenecks
Analyze the test results to observe how the database performs under load. Look for bottlenecks or performance issues like slow queries, locks, or indexing problems. Depending on the issues found, you may want to modify your database configuration, query design, indexing strategy, or hardware resources.
Database benchmarking with Aerospike
Benchmarking NoSQL databases is challenging because there are so many potential variables and workloads that they handle. According to benchANT, an independent database benchmarking company, in a detailed blog post about the history of database benchmarking,
“One of the biggest challenges in cloud database benchmarking is the incredible number of nearly a billion possible configuration options,” benchANT writes. “To get results in a reasonable amount of time, this huge selection space must be narrowed down in advance through knowledge acquisition and educated guessing.”
But chances are, if you’re here, instead of running your own benchmark, what you really want to know is how Aerospike stacks up against the competition. Aerospike posts all of its comparison benchmarks and updates the page whenever new ones are added. These are the ones we’ve performed so far.
AWS Graviton and Aerospike
This one’s a little different – it benchmarks Aerospike running on AWS Graviton2 clusters compared with x86 clusters.
Aerospike observed 63% better price performance using a Graviton2 cluster when compared with an equivalent x86 cluster.
The Graviton2 cluster processed 25 million transactions per second, while the x86 cluster processed 21.1 million; this translated to an 18% higher throughput rate for the Graviton cluster.
The annual cost for the Graviton2 cluster was 27% less.
Environmentally, Aerospike saved 49%, confirmed by AWS, on carbon emissions when running its workload on the Graviton2 cluster rather than the x86 cluster, holding vCPUs constant.
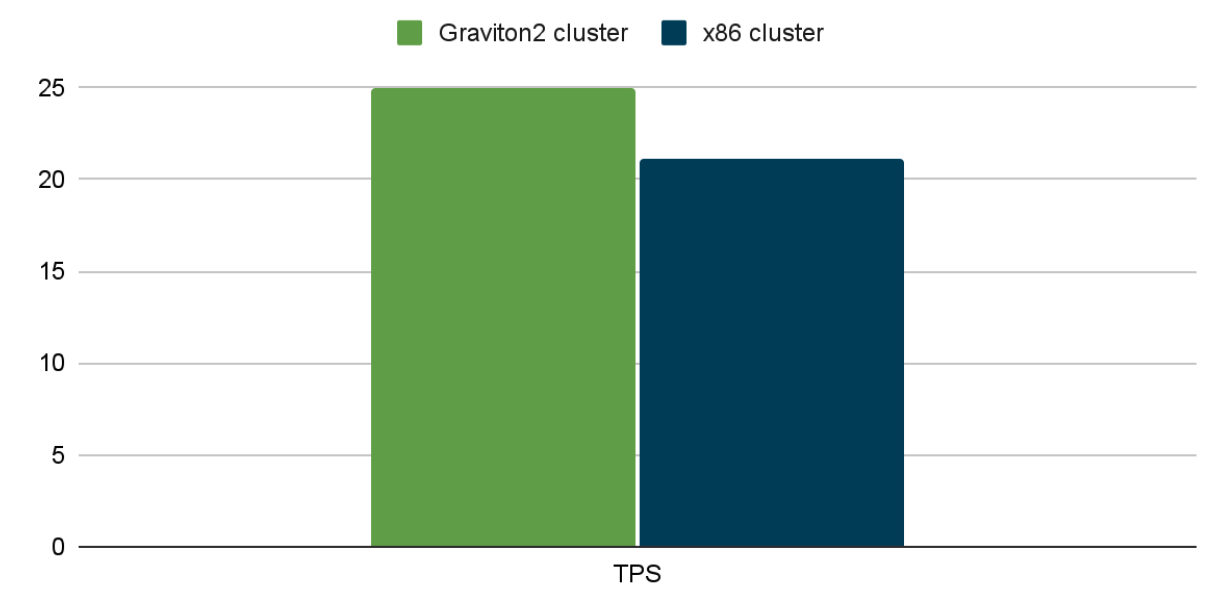
Aerospike transaction throughput (millions per second)
Check out the full AWS Graviton and Aerospike benchmarking report.
AWS Intel and Aerospike
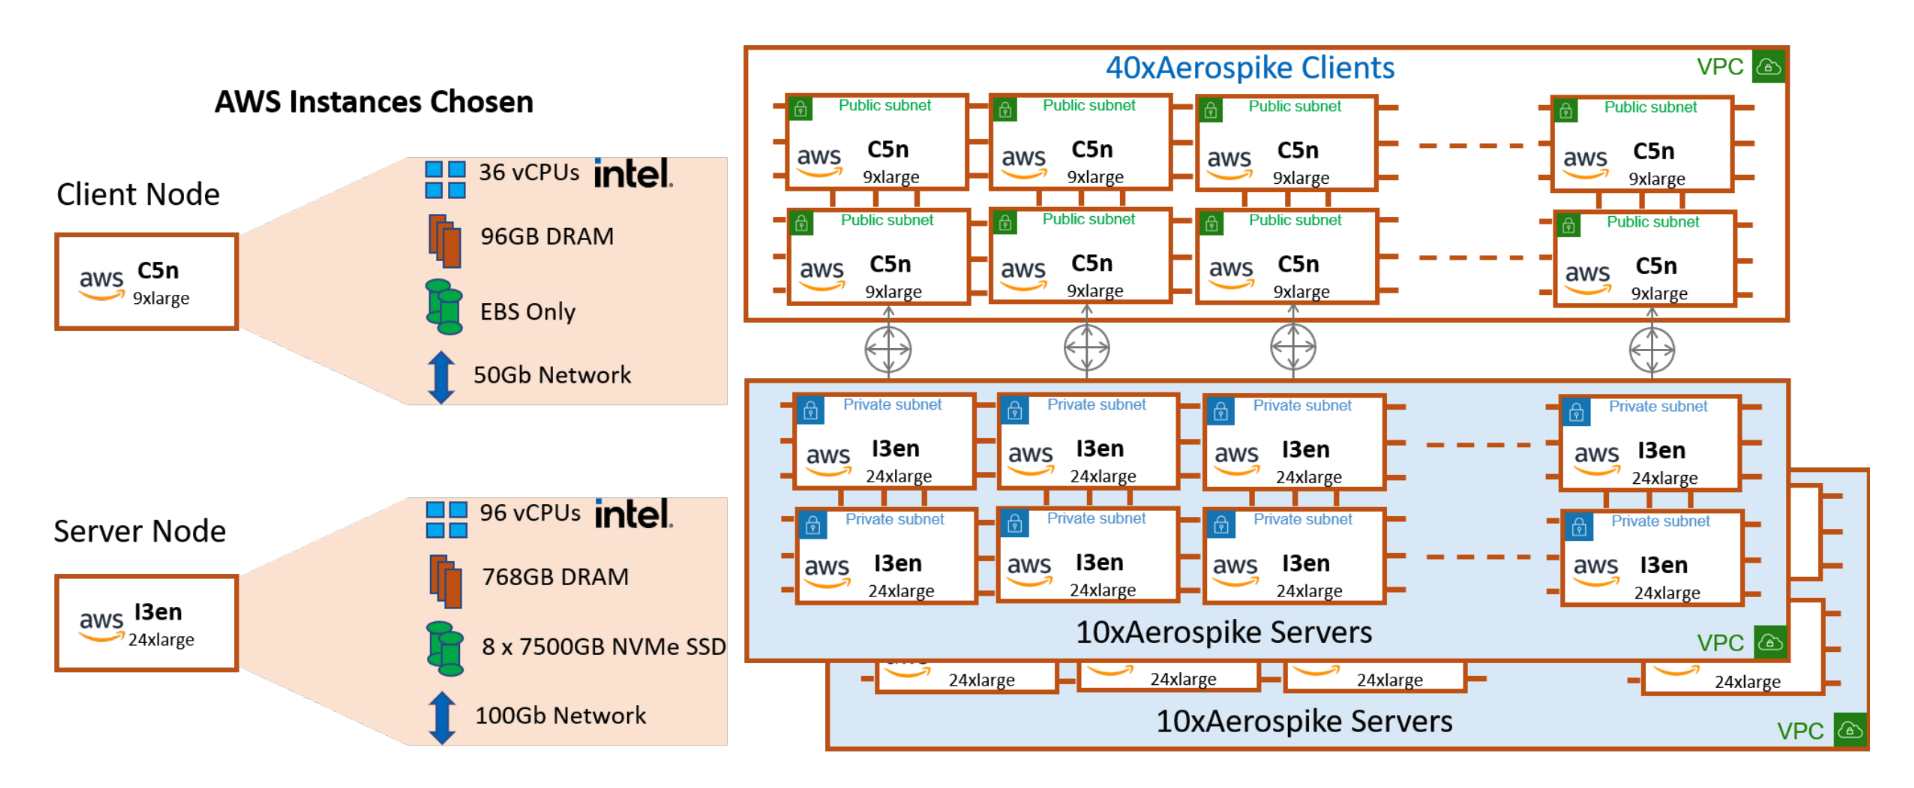
This one’s also a little different. It’s a benchmark specifically of a petabyte-scale database running on a 20-node AWS Intel cluster.
Aerospike served more than 5 million transactions per second for read-only operations.
Aerospike served more than 3.7 million TPS for 80/20 read/write operations.
For an AdTech campaign database of 1.5 TB and 50/50 read/write operations, Aerospike served more than 190,000 TPS.
Both benchmarks had 100% sub-millisecond latency for read operations and 99% sub-millisecond latency for write operations.<
Check out the full AWS Intel and Aerospike benchmarking report
Cassandra vs. Aerospike
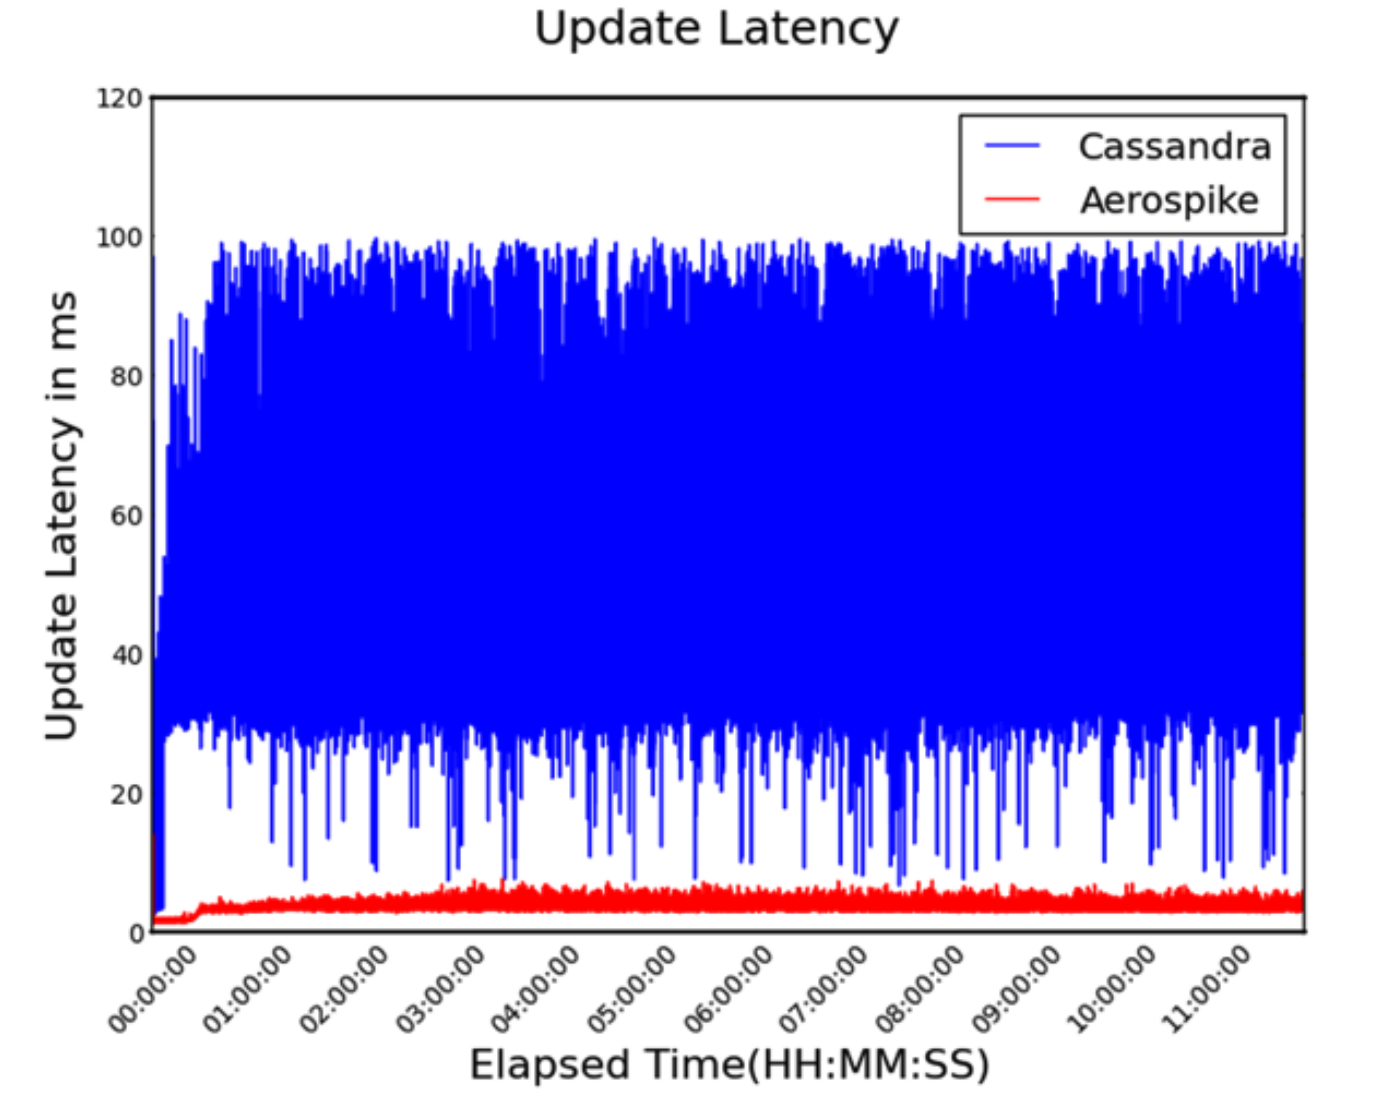
Independent benchmark results comparing Aerospike 8.0.4 and Apache Cassandra 5.0.3 in three production-grade scenarios.
Aerospike significantly outperformed Cassandra, achieving up to 3.5x higher throughput, 9x lower P99 read latency, and 5.2x greater cost-efficiency using fewer nodes.
Aerospike sustained 480K ops/sec with <1ms P99 latency
Cassandra required 50% more hardware, and still underperformed
Both databases handled live scale-out and node failure
Measured variance in read/write latency
Check out the full Cassandra vs. Aerospike benchmarking report, as well as our report comparing Cassandra with Aerospike.
DynamoDB vs. Aerospike
DynamoDB performance struggles to keep up at scale, and its pricing only gets worse as you grow. If your applications demand predictable low latency, high throughput, and operational affordability, Aerospike is the better choice.
This independent benchmark by McKnight Consulting Group compares Aerospike, DynamoDB, and DynamoDB with DAX across 1 TB, 5 TB, and 10 TB datasets for both 70/30 and 100/0 read/write workloads. The results are clear: Aerospike outperforms on every front, including latency, throughput, and total cost of ownership, at every scale.
100× higher throughput: Aerospike achieved over 100x more operations per second than DynamoDB across equivalent workloads.
600K+ sustained ops/sec: During a simulated node failure, Aerospike maintained 600,000+ transactions per second, with only an 11% performance dip and full recovery in under three minutes.
12.5× lower cost vs DynamoDB w/ DAX: Aerospike’s total infrastructure cost was 8.5× lower than DynamoDB and 12.5× lower than DynamoDB with DAX acceleration.
No caching required: Aerospike ran entirely without caching, while DynamoDB relied on DAX to even partially compete in latency and throughput.
Consistent low latency: Aerospike delivered uniform sub-millisecond latency, whereas DynamoDB exhibited higher, more variable response times even with DAX.
Optimized storage efficiency: Aerospike’s Hybrid Memory Architecture (RAM-based indexes + SSD storage) provided near-DRAM performance at much lower cost and complexity.
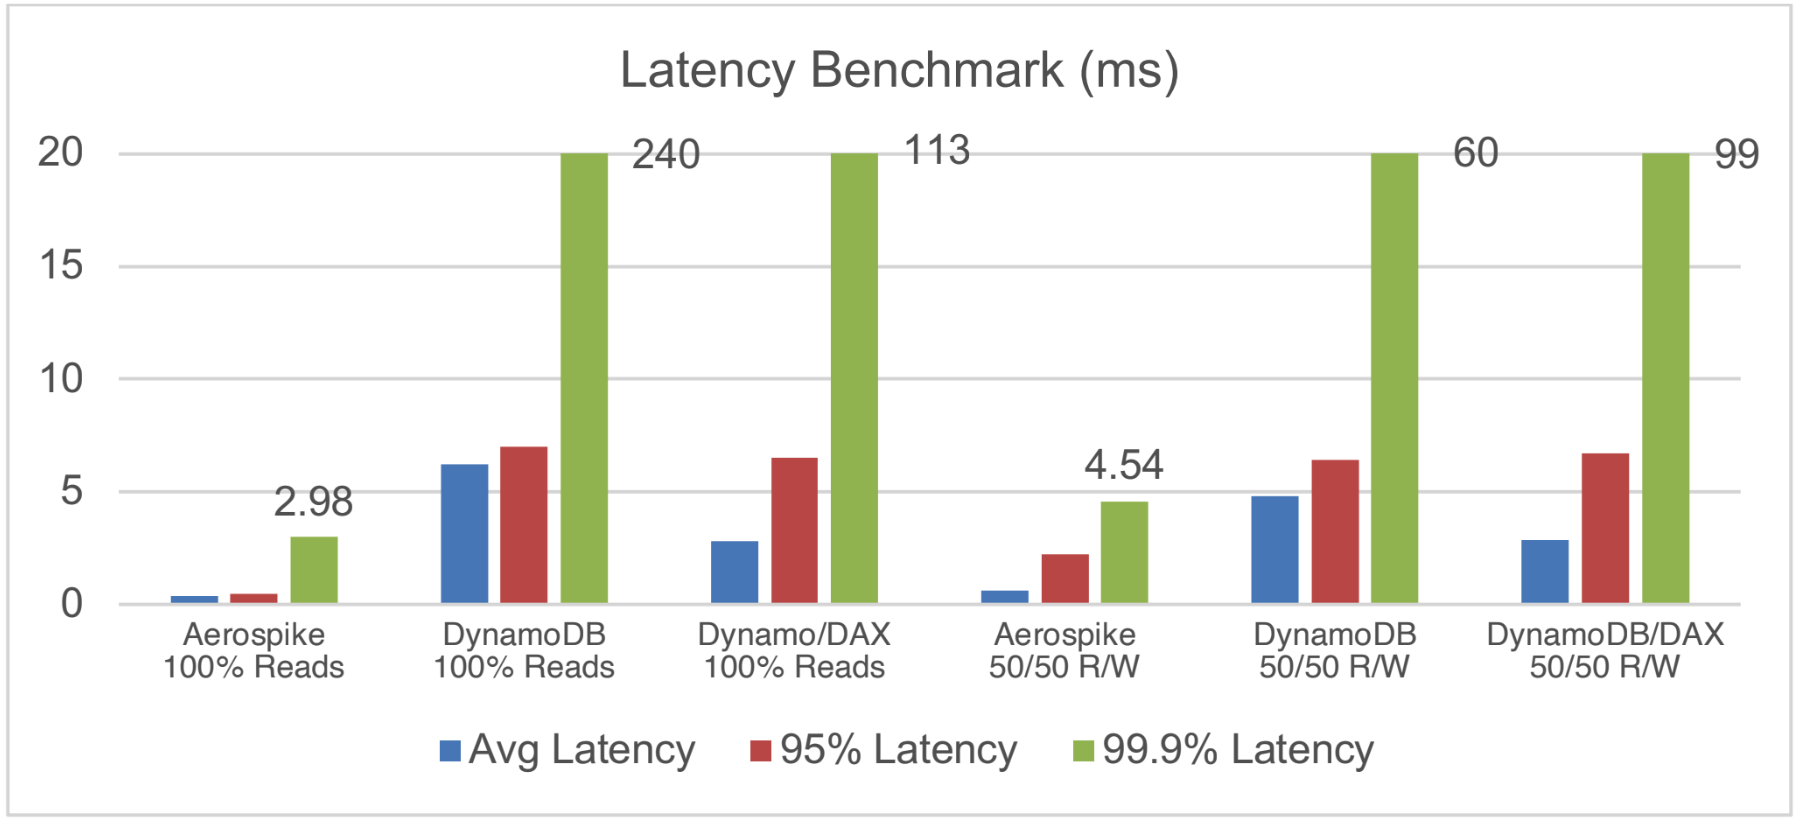
Aerospike vs. DynamoDB benchmark data using different configurations and usage patterns A note: Both DynamoDB and DynamoDB with DAX have higher latency numbers than Aerospike for all cases.
Check out the full DynamoDB vs. Aerospike benchmarking report.
Redis vs. Aerospike
Up to 9.5× lower infrastructure cost: Aerospike delivered significantly lower annual cost per transaction than Redis across 1 TB, 5 TB, and 10 TB workloads.
17–48% lower p99 latency: Aerospike consistently achieved lower tail latency (p99) than Redis under both 70/30 and 100/0 read/write workloads.
11–24% higher throughput: Across all data scales tested, Aerospike outperformed Redis in operations per second (TPS).
57-minute Redis failover vs 3-minute Aerospike recovery: Under failure tests, Redis took up to 57 minutes to failover with risk of data loss. Aerospike recovered in ~3 minutes with negligible TPS impact.
Hybrid Memory Architecture efficiency: Aerospike’s RAM+SSD design enabled sub-millisecond latency and 100K–1M+ TPS without Redis’s all-RAM overhead.
Superior scalability: Aerospike’s multi-threaded, distributed architecture scaled efficiently with less operational complexity than Redis clusters.
Check out the full Redis vs. Aerospike benchmarking report and our report comparing Redis with Aerospike.
ScyllaDB vs. Aerospike
Aerospike serves more than 7.17x read/write transactions than ScyllaDB.
Read/write latency was 3.2x greater with ScyllaDB than with Aerospike.
Insert throughput was 7.9x faster with Aerospike than with ScyllaDB.
Total cost of ownership was 7x greater with ScyllaDB than with Aerospike.
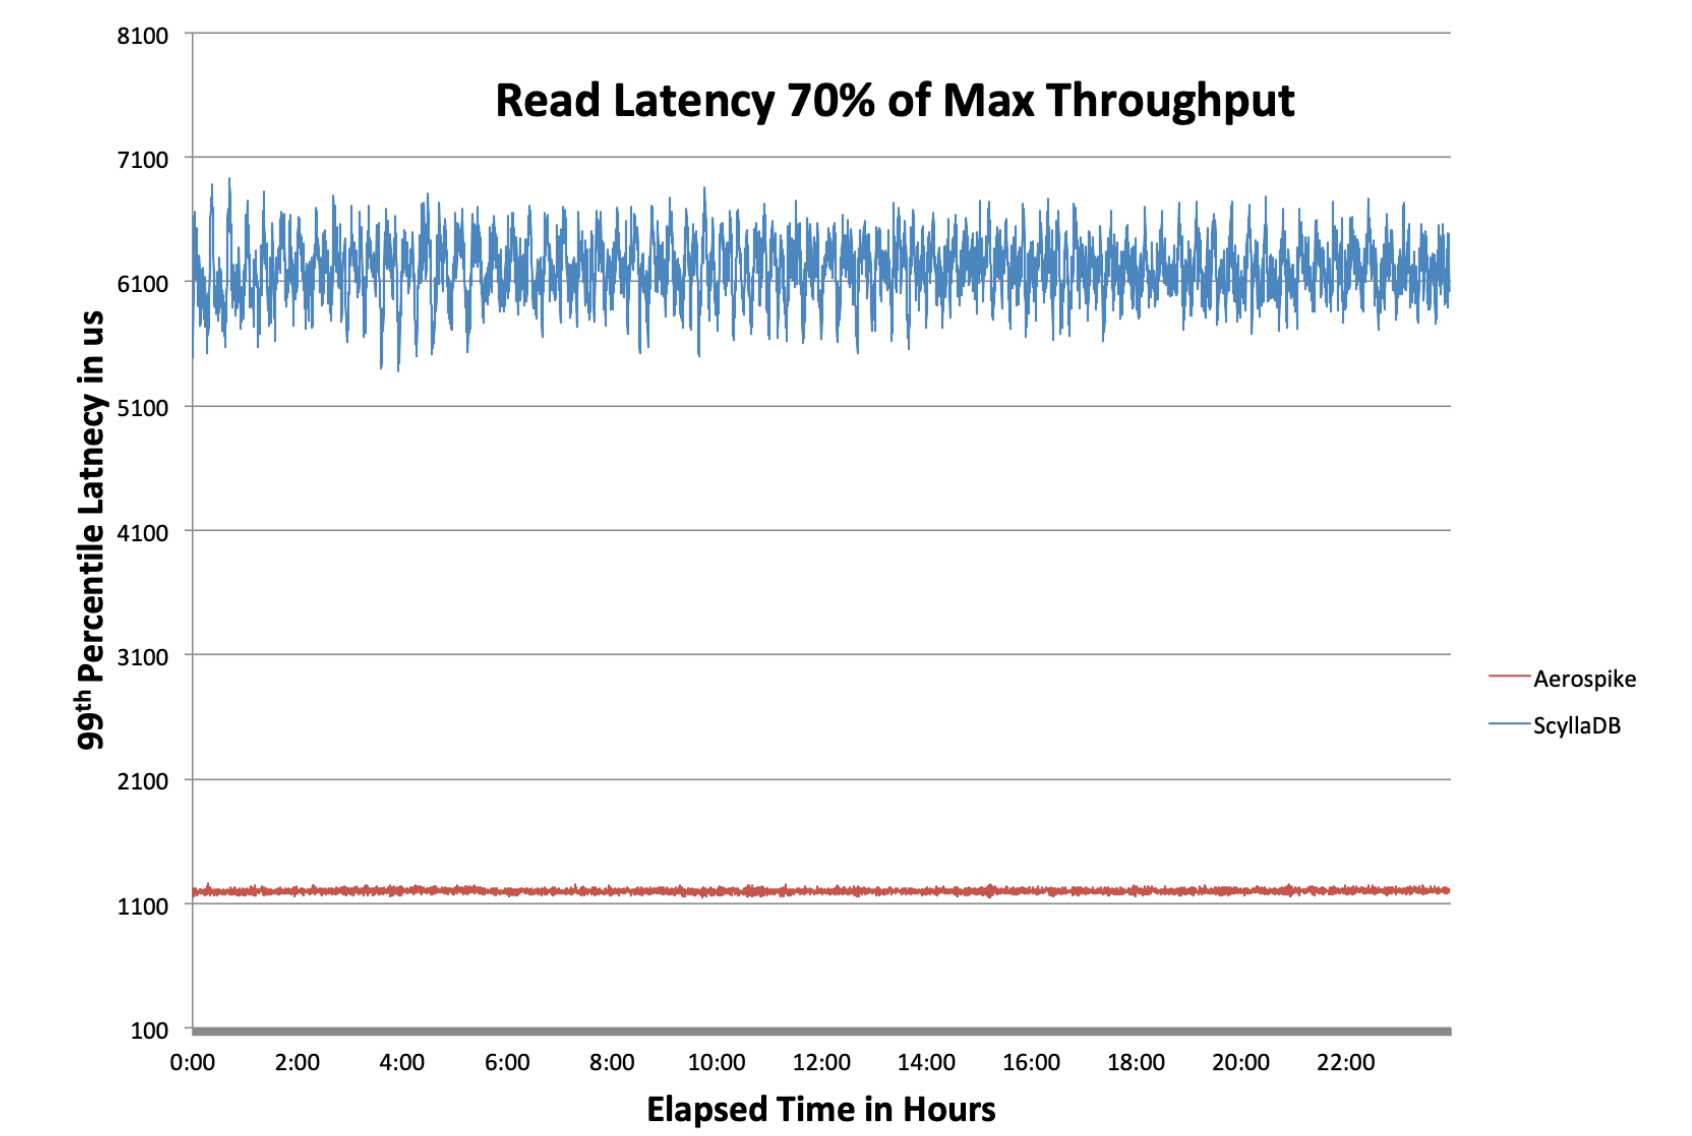
Read latencies for Aerospike and ScyllaDB at 70% load
Explore Aerospike benchmarks
Finally, keep in mind that benchmarks aren’t the be-all and end-all of your purchasing decision. Other factors to consider include total cost of ownership (TCO), ease of use, features, and support. Benchmarks are just one factor to consider.
Read our benchmark section to view our latest benchmarks.
Keep reading

Jun 17, 2026
Fail fast, stay resilient: How to stop hidden gray failures in Aerospike on AWS EBS

May 28, 2026
Determining the best machine learning and AI databases

May 18, 2026
The three price tags: How Redis unpredictability costs you infrastructure, engineering time, and UX

May 12, 2026
Monitoring Aerospike Enterprise in Datadog: What you get and how it works