Cloud Qualification Details
While the Cloud Qualification process presents a simplified summary of instance performance, many specifics are glossed over. This page will dive more in-depth as to what occurs during the qualification process.
Disks
The qualification process seeks to measure the performance of an instance. If a certain instance comes with local disks, they will be used. Network based disks are not tested and are not in the scope of the qualification process.
Bottlenecks
Since instances vary in network and CPU, it is definitely possible that the instance could be bottlenecked by factors other than storage. Due to the cumulative nature of the qualification, these bottlenecks would not be accounted for and would be reflected in the final outcome. The qualification process looks at the instance as a whole, any bottlenecks included.
Defragmentation
Defragmentation is an automatic background process that occurs to consolidate partially filled blocks and produce empty blocks. The impact of defragmentation is heavily dependant on data update/delete patterns.
The more uniform the updates, the more pronounced the initial defragmentation impact.
This is not common usage and would be unlikely under typical workload.
Defragmentation kicks in when a block's usage drops below defrag-lwm-pct. This can occur through updates and deletes, as Aerospike always writes new data to empty blocks. With a uniform write/update pattern, all blocks will become eligible for defragmentation in a very short amount of time. This can be seen as a "wall" of defragmentation, where reads and writes suddenly spike. You can see this in the following charts.
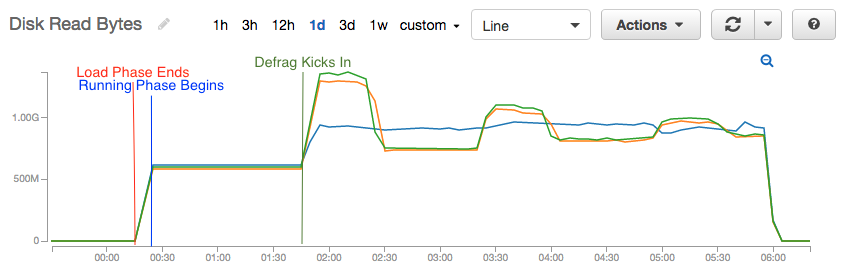
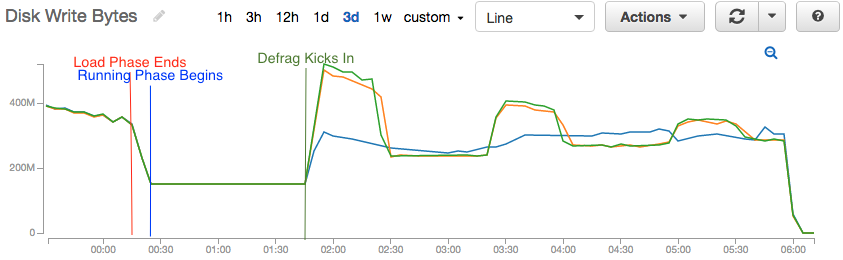
You can see the initial spike in writes as defragmentation initially kicks in. You can also see a second and third spike when another pass of the now defragmented data is eligible for defragmentation as well. Each subsequent defragmentation is less severe as data becomes increasingly shuffled through the defragmentation process.
You can also see the defragmentation driven load in our sample log lines below, by looking at the various defrag stats. The log format can be found here and the raw log can be downloaded here.
Feb 22 2017 22:29:14 GMT: INFO (drv_ssd): (drv_ssd.c:2092) {ssd} /dev/sdb: used-bytes 40235139840 free-wblocks 14877 write-q 0 write (69857,13.9) defrag-q 11267 defrag-read (19205,116.8) defrag-write (3943,9.2)
Feb 22 2017 22:29:34 GMT: INFO (drv_ssd): (drv_ssd.c:2092) {ssd} /dev/sdb: used-bytes 40235139584 free-wblocks 14981 write-q 0 write (70143,14.3) defrag-q 13289 defrag-read (21617,120.6) defrag-write (4135,9.6)
A quick before and after comparison, looking at write and defrag-write:
Feb 22 2017 22:25:14 GMT: INFO (drv_ssd): (drv_ssd.c:2092) {ssd} /dev/sdb: used-bytes 40235139584 free-wblocks 13567 write-q 0 write (66326,11.1) defrag-q 2 defrag-read (3099,13.1) defrag-write (1536,6.4)
...
Feb 22 2017 23:02:14 GMT: INFO (drv_ssd): (drv_ssd.c:2092) {ssd} /dev/sdb: used-bytes 40235139584 free-wblocks 28139 write-q 0 write (98166,10.3) defrag-q 0 defrag-read (49508,5.0) defrag-write (23001,5.6)
Shows:
32,140 blocks written overall, of which:
21,465 are from defragmentation. That leaves the remaining
10,675 from client initiated write transactions.
In this scenario, defragmentation is double the normal write load over roughly 40 minutes.
Variability
Cloud instances are susceptible to variability in performance. This again can be see in the same graph, where each instance in the 3 node cluster has a different read/write rate.
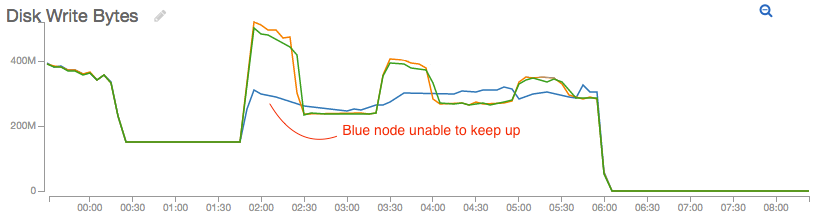
Notice that the blue node simply cannot keep up with defragmentation, so it never falls to the new baseline that the green and orange nodes do. This cluster would not be suitable for further qualifications.
To minimize variabililty, poor performing instances can be terminated or the entire cluster replaced. You can monitor for variability by using external monitoring tools like AWS Cloudwatch (as above), and by checking on the latencies within asadmin.
Using the same time range as the sample log lines above:
Admin> loglatency -h {ssd}-read -b 4 -e 1 -t 600 -f 'Feb 22 2017 22:20:00'
~~~~~~~~~~~~~~~~~~~~~~~~~~~~~~~~~~~~~~~~~~~~~~~~~~~~~~~~~~~~~~~~~~~~~~~~~~~~~~~~~~~~~~~{ssd}-read Latency (Page-1)~~~~~~~~~~~~~~~~~~~~~~~~~~~~~~~~~~~~~~~~~~~~~~~~~~~~~~~~~~~~~~~~~~~~~~~~~~~~~~~~~~~~~~~~~
NODE                :   bb94bf824acdc0a    .        .        .        .          |   bb95b7543cf7d0a    .        .        .        .          |   bb98126cae8840a    .        .        .        .          |
.                   :   % >1ms             % >2ms   % >4ms   % >8ms   ops/sec    |   % >1ms             % >2ms   % >4ms   % >8ms   ops/sec    |   % >1ms             % >2ms   % >4ms   % >8ms   ops/sec    |
Feb 22 2017 22:30:10:   73.78              65.94    55.77    42.90    9825.0     |   21.52              13.98    6.05     2.04     9580.0     |   23.70              15.75    7.47     2.45     9345.3     |
Feb 22 2017 22:40:10:   73.74              65.74    54.84    40.98    9971.0     |   26.34              17.99    8.29     2.99     9676.2     |   24.09              16.24    7.42     2.31     9480.3     |
Feb 22 2017 22:50:10:   72.83              65.09    54.53    40.85    9960.1     |   31.60              23.26    13.18    6.29     9741.7     |   28.36              20.61    11.83    5.83     9460.2     |
Feb 22 2017 23:00:10:   72.43              64.63    54.02    40.51    10025.9    |   30.95              22.74    12.90    6.26     9765.1     |   30.06              22.12    13.08    6.69     9526.9     |
Feb 22 2017 23:10:10:   73.50              65.59    54.90    41.28    9775.3     |   21.95              15.49    8.43     3.85     9547.6     |   28.93              20.88    11.85    5.52     9310.0     |
Feb 22 2017 23:20:10:   74.05              66.23    55.63    42.00    10036.6    |   22.36              16.17    9.50     4.88     9784.1     |   29.06              21.43    12.88    6.46     9551.8     |
You can see the latency for the 1st node bb94bf824acdc0a is significantly worse than the other two. While the other nodes have 20-30% of operations break 1ms, the 1st node had over 70% of operations break 1ms. 4ms and 8ms metrics are even more drastic.
A similar result can be seen with writes:
Admin> loglatency -h {ssd}-write -b 4 -e 1 -t 600 -f 'Feb 22 2017 22:20:00'
~~~~~~~~~~~~~~~~~~~~~~~~~~~~~~~~~~~~~~~~~~~~~~~~~~~~~~~~~~~~~~~~~~~~~~~~~~~~~~~~~~~~~~~~~{ssd}-write Latency (Page-1)~~~~~~~~~~~~~~~~~~~~~~~~~~~~~~~~~~~~~~~~~~~~~~~~~~~~~~~~~~~~~~~~~~~~~~~~~~~~~~~~~~~~~~~~~
NODE                :   bb94bf824acdc0a    .        .        .        .           |   bb95b7543cf7d0a    .        .        .        .           |   bb98126cae8840a    .        .        .        .           |
.                   :   % >1ms             % >2ms   % >4ms   % >8ms   ops/sec     |   % >1ms             % >2ms   % >4ms   % >8ms   ops/sec     |   % >1ms             % >2ms   % >4ms   % >8ms   ops/sec     |
Feb 22 2017 22:30:10:   91.82              84.27    74.20    59.32    9830.2      |   62.98              47.78    33.13    19.32    9571.1      |   65.90              50.17    35.33    20.87    9336.0      |
Feb 22 2017 22:40:10:   91.35              83.90    73.83    58.53    9979.6      |   65.44              51.15    36.31    21.66    9682.8      |   64.78              49.81    35.26    21.01    9481.3      |
Feb 22 2017 22:50:10:   90.32              82.69    72.57    57.15    9957.9      |   67.35              53.81    39.25    24.10    9734.7      |   66.38              52.10    37.74    23.25    9461.4      |
Feb 22 2017 23:00:10:   90.03              82.35    72.19    56.99    10019.3     |   66.97              53.48    39.06    24.18    9764.8      |   67.26              53.16    38.98    24.39    9529.1      |
Feb 22 2017 23:10:10:   90.98              83.40    73.29    58.07    9770.5      |   60.46              46.28    33.21    20.34    9536.6      |   66.87              52.23    37.96    23.45    9309.3      |
Feb 22 2017 23:20:10:   91.08              83.66    73.56    58.27    10035.0     |   60.89              46.51    33.40    20.33    9786.7      |   67.13              52.26    38.02    23.22    9548.3      |
The cause of variablity can range from noisy neighbors to differing SSD models used in the the cloud environment.