
As promised in the March 2016 announcement of the Aerospike Node.js Client v2.0 early adopter release, today we are going to take a closer look at the performance gains resulting from the switch to non-blocking I/O in the underlying Aerospike C/C++ client library.
Asynchronous Or Not?
Node.js’s asynchronous, event-driven programing model is designed to build scalable network applications. To fit this model, the Aerospike Node.js Client has always provided an asynchronous interface to the Aerospike database: when a database command is issued, such as GET or PUT, the client delivers the result through a callback function, while the main function call returns immediately. But under the hood, the Node.js client used blocking I/O calls via the Aerospike C/C++ client library when communicating with the Aerospike cluster.
In order not to block the execution of the JavaScript code on Node’s event loop, the native add-on of the Aerospike Node.js Client v1 had to execute the blocking database commands on a separate thread. Node.js, through the use of libuv, provides a thread pool that can be used to run user code and get notified in the event loop thread when the work is completed. Once the blocking database operation is completed, the client application is notified on the event loop thread through the asynchronous callback function.
With the release of version 4 of the Aerospike C/C++ Client, the use of a separate thread pool is no longer necessary, as the client supports an asynchronous programming model using the same libuv library that runs Node’s event loop. This means that the communication with the Aerospike server cluster happens on the event loop thread itself, using libuv’s non-blocking TCP streams.
Benchmarking Performance Improvements
To measure the performance impact of using non-blocking I/O, we used the benchmark suite that’s included with the Aerospike Node.js client. The benchmark performs a 50/50 mix of single-key read and write operations (GET/PUT) and measures the throughput in database operations per second (OPS). The benchmark was performed against a cluster of two nodes running Aerospike Server Community Edition version 3.8.1 on Ubuntu 12.10 with Intel® Core™ i5-2400 processors and 32 GB of memory. The test namespace was set up as in-memory storage with a replication factor of 1. On the client side, we ran Aerospike Node.js Client versions 1.0.57 and 2.0.3 on identical machines. The benchmark suite was configured to use four processes to make use of all processor cores. In addition to throughput in database operations per second, the benchmark suite also records response time.
With the v1.0.57 client, we were able to achieve about 54,800 combined read and write operations per second. About 37% of all requests received a response in less than 1 ms; 99.7% of all requests received a response in less than 8 ms.
As previous testing has shown, the performance of the v1 client improves as the number of libuv worker threads is increased. The default thread pool size is 4; we found that doubling the pool size to 8 worker threads maximizes the read/write throughput in our setup. When configuring Node.js via the UV_THREADPOOL_SIZE environment variable accordingly, the client’s throughput improved by more than 10%, to 60,700 transactions per second; however, response times were not affected significantly.
Running the same benchmark with the v2.0.3 client resulted in a marked performance improvement. We were able to achieve about 78,500 read & write operations per second – an increase of more than 29% over the performance of the v1.0.57 client! About 34% of all requests received a response in less than 1 ms; 99.8% of all requests received a response in less than 4 ms. While slightly fewer transactions completed with sub-millisecond response times, the average response times – as well as the variance – were much lower. Since the v2 client does not use libuv worker threads for most database operations, the size of the worker thread pool does not affect its performance.
Here are the numbers for all three benchmark runs:
Client Version (Thread Pool Size) | v1.0.57 ( TP = 4 ) | v1.0.57 ( TP = 8 ) | v2.0.3 ( TP = 4 ) |
Operations / second | 54,791 | 60,679 | 78,474 (+29.3%) |
Latency <= 1 ms | 37.2% | 38.9% | 33.8% |
< 2 ms (cumulative) | 65.7% | 67.8% | 82.9% |
< 4 ms (cumulative) | 90.6% | 90.3% | 99.8% |
< 8 ms (cumulative) | 99.7% | 98.5% | 100% |
< 16 ms (cumulative) | 100% | 100% | 100% |
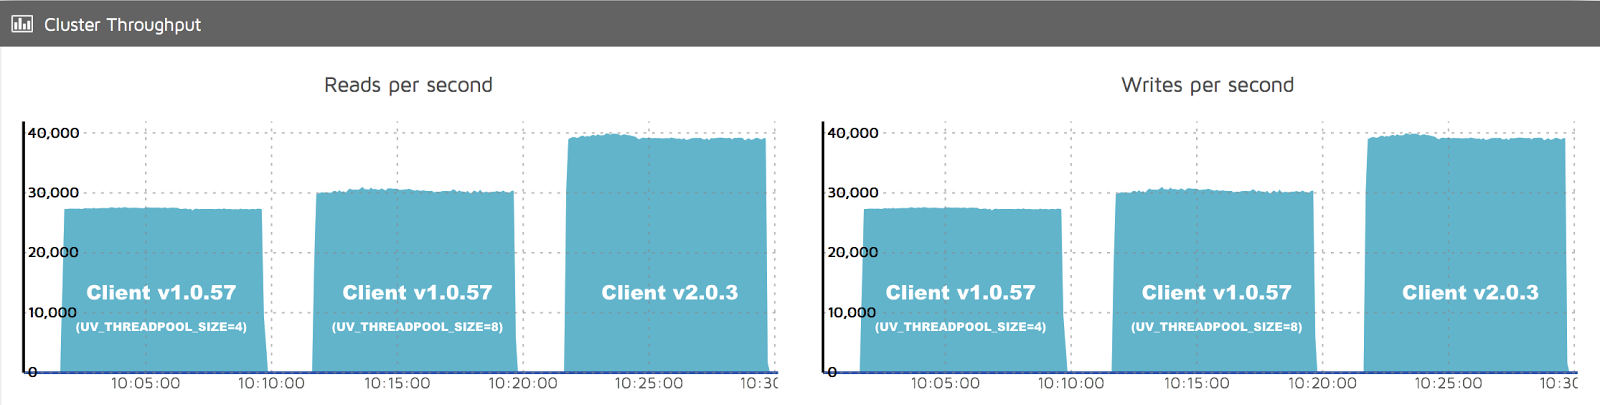
The performance improvement is also clearly visible in the Cluster Throughput view of the Aerospike Management Console (AMC):
Improved Query and Scan Performance
In the v2.0 early adopter release announcement, we also talked about some of the new features of the v2 client, such as the new Batch Read command. One feature that did not make it into the first alpha release, but was included in the final v2.0.0 release, is a new interface for performing query and scan operations. Like all the single-key operations (GET, PUT, etc.) the new query and scan operations use non-blocking I/O for a significant performance improvement.
The query implementation in the v1 client was problematic in that it buffered the query results from the cluster nodes on the client. Processing the buffered results could block the event loop if the client was not able to process the records as fast as they were fetched from the cluster. Client-side buffering could also lead to excessive memory usage.
We also wanted to measure how the non-blocking I/O of the v2 client impacted query performance – both in terms of throughput (in records per second) as well as in-memory usage. To do so, we ran a query against a data set consisting of 1 million records of 1 KB size each. We tested query performance in two different scenarios. In the first scenario, the client just receives the records, but does not perform any work with them. This setup would show us the maximum throughput the client is able to achieve while reading results from the cluster. However, this is not a very realistic scenario. Therefore, in the second scenario, we added some asynchronous I/O; in this setup, the client writes all records to a file-backed output stream as it receives them. The second scenario provides a more realistic view of the client’s performance and memory consumption patterns. As will be clear from the test results, the added file I/O slows down the query processing significantly. Ideally, this will lead to back pressure being exerted into the TCP connection to the cluster nodes, leading the server to slow down the data transmission. Worst case, the client would start buffering the results without being able to process the concurrent file I/O effectively.
And indeed, this is exactly what we observed. In the first scenario, we measured a throughput of 36,700 records / second (RPS) with the v1 client. With the v2 client, we saw a moderate performance improvement as we measured a RPS throughput of 40,100 – an improvement of about 9.2%. The v2 client’s throughput improvement was achieved with significantly reduced overall memory consumption. While the v1 client used a total of 184 MB of memory during the test, the v2 client only consumed 40 MB – a reduction of nearly 80%!
When we ran the tests for the second scenario, the results were even clearer. Here, the v1 client managed a throughput of only 2960 RPS, while the v2 client achieved a 18% higher throughput of nearly 3500 RPS. And while the v2 client used 111 MB in this test, the v1 client’s memory usage exceeded 4.3 GB:
Client Version (Thread Pool Size) | v1.0.57 ( TP = 8 ) | v2.0.3 ( TP = 4 ) | |
Scenario 1 | Throughput (RPS) | 36,730 | 40,109 (+9.2%) |
Maximum memory usage | 184 MB | 40 MB (-78.3%) | |
Scenario 2 | Throughput (RPS) | 2,963 | 3,494 (17.9%) |
Maximum memory usage | 4,469 MB | 111 MB (-97.5%) |
We also ran a similar test for scan operations, which were split out into a separate interface in the v2 client (in the v1 client, the Query interface handles both query and scan operations.) As the results were very comparable to the query results, we did not include them here. Both the query and the scan performance test are included with the Aerospike Node.js client package, so you can easily reproduce the tests in your own environment.
For more information on the new Query and Scan APIs in the v2 client, please refer to the API documentation here and here.
Resources
The benchmark use for the performance measurements is part of the Aerospike Node.js Client package and can be found in the benchmarks directory. Both the server-side aerospike.conf config file and the config.json config file used to run the Node.js benchmark can be found on Github. The query/scan performance tests are part of the client’s test suite and can be found in the test/stress directory of the client repo.
Summary
As always, we need your help and input to continue to improve and enhance your DX (developer experience). Please contribute your feedback, ideas and questions to our user forum, file Github issues or create a pull request for the next great feature you’d like to contribute to the Aerospike user community!
Keep reading

Jun 17, 2026
Fail fast, stay resilient: How to stop hidden gray failures in Aerospike on AWS EBS

May 28, 2026
Determining the best machine learning and AI databases

May 18, 2026
The three price tags: How Redis unpredictability costs you infrastructure, engineering time, and UX

May 12, 2026
Monitoring Aerospike Enterprise in Datadog: What you get and how it works